
Introduction to Technical Analysis: Reading Charts Like a Pro
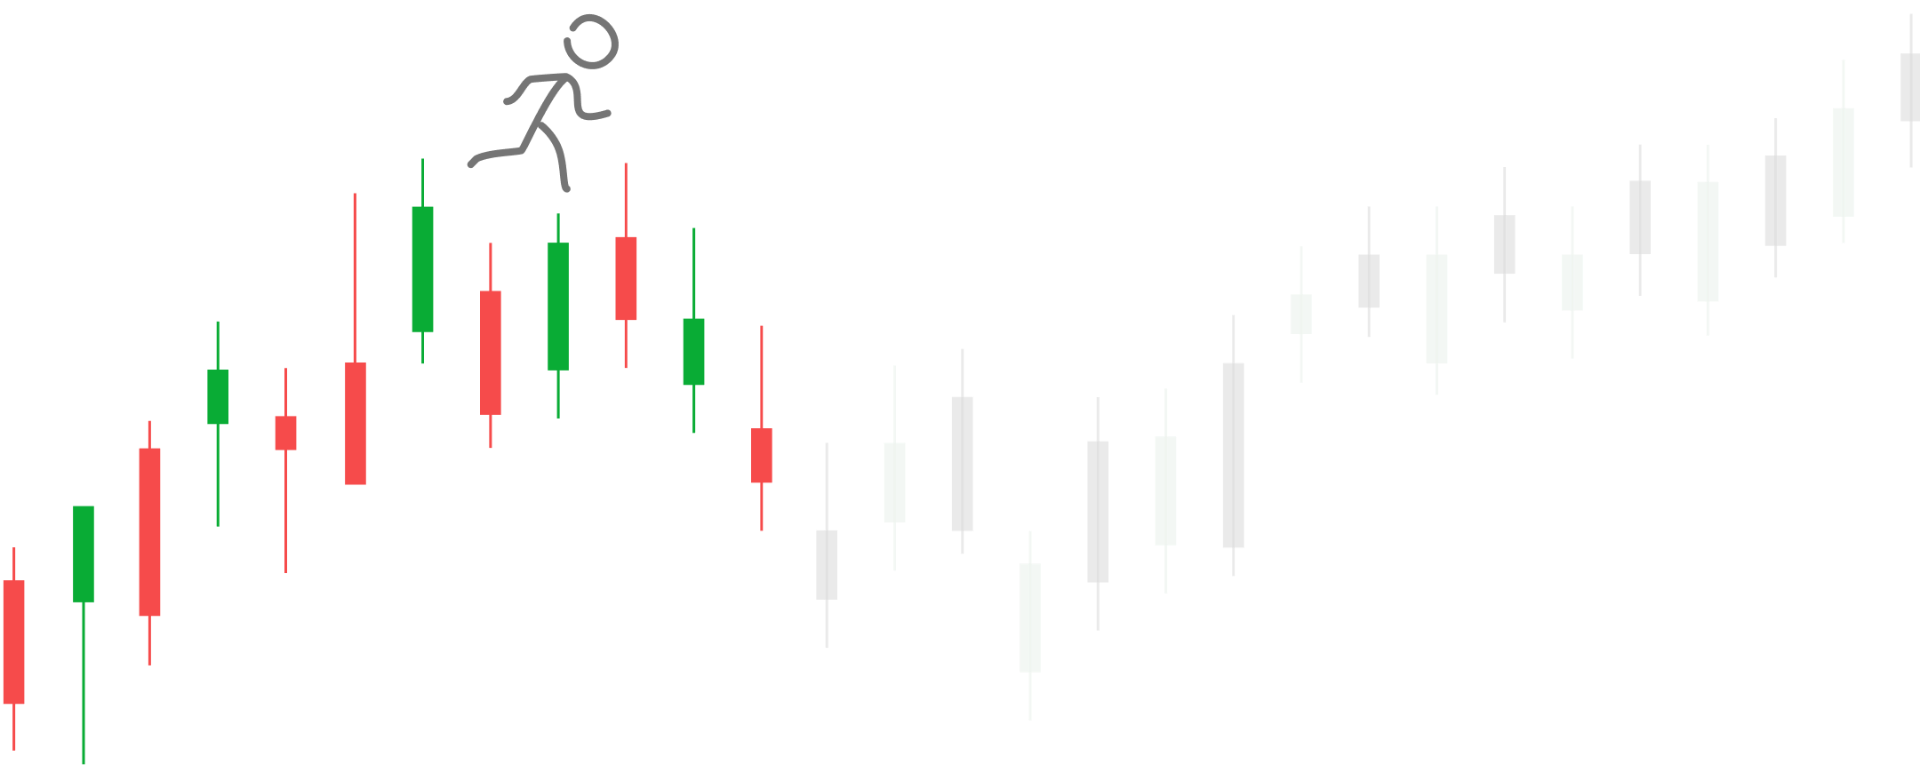
Technical analysis is the study of past price movements and volume data to predict future price movements. Unlike fundamental analysis, it focuses on 'what' the price is doing rather than 'why'.
Charts are the primary tool of a technical analyst. The three most common chart types are line charts, bar charts, and candlestick charts. Candlestick charts are the most popular among traders because they provide the most information.
Support and resistance levels are horizontal price levels where buying or selling pressure tends to emerge. Support is the floor, and resistance is the ceiling. Understanding these levels is fundamental to trading.
Trend lines help you identify the direction of price movement. An uptrend has higher highs and higher lows. A downtrend has lower highs and lower lows. Trading with the trend significantly improves your success rate.
Indicators like RSI (Relative Strength Index), Moving Averages, and MACD help confirm trade setups. However, they should be used as confirmation tools, not primary decision-makers.
At Market Paathshaala, CA Rahul Ranka teaches you to combine multiple technical analysis tools into a cohesive trading strategy that works in Indian markets.